Following up from the last post, I was looking forward to finally making some changes to the island environment to improve its performance. Unfortunately when I tried to simply repeat the measurement from the last post, I got fairly different measurements. After giving this some thought, I came up with these two possible explanations, and an approach to solve each.
| Problem | Solution |
|---|---|
| The Unity Profiler is awkward to switch on/off while wearing a VR headset. | Write a small script that automatically turns off the Profiler after a certain number of seconds. |
| There is a lot of variability within the frames of a recorded segment. Rather than looking at a few random frames, it would be more reproducible to always refer to the frame having median CPU time. | Use the Profile Analyzer tool to identify the median frame. |
Here is the small script mentioned above. Without this script, I find myself struggling to hit the Record button in the Unity Profiler while wearing the Oculus Rift. (I have not been able to identify any screen shortcuts to the Profiler Record button. If any readers know of one, please let me know.) While I struggle to hit the button, I am looking up while trying to peek out of the Rift. This awkward movement likely also affects the performance profile itself. The script simply starts recording a Profiler when the scene begins, and stops recording 10 seconds later. So none of this needs to be done manually. A sound is played at the beginning and end of the recording.
using System.Collections;
using UnityEngine;
using UnityEngine.Profiling;

public class AutoProfile : MonoBehaviour
{
    AudioSource myAudioSource;
    void Start()
    {
        myAudioSource = GetComponent<AudioSource>();
        myAudioSource.Play();
        Profiler.enabled = true;
        StartCoroutine(StopProfiling());
    }

    IEnumerator StopProfiling()
    {
        yield return new WaitForSeconds(10);
        Profiler.enabled = false;
        myAudioSource.Play();

    }
}
I simply create an empty game object called AutoProfiler (or whatever you want), add this script, and add an AudioSource component to play the sound. Any sound clip can be added to the AudioSource’s AudioClip field. I used the “water” clip that is in the project already as part of the Oculus Utilities for Unity that I added in a previous post.
For the other improvement, as mentioned above, I use the new Profile Analyzer tool. Here is an overview video from Unite Copenhagen 2019:
For recent versions of Unity — I am using 2019.1.2 — you can install the Profile Analyzer by launching the Package Manager under the Window menu. Under Advance, choose “Show preview packages.” Choose the Profile Analyzer from the list and click “Install.”
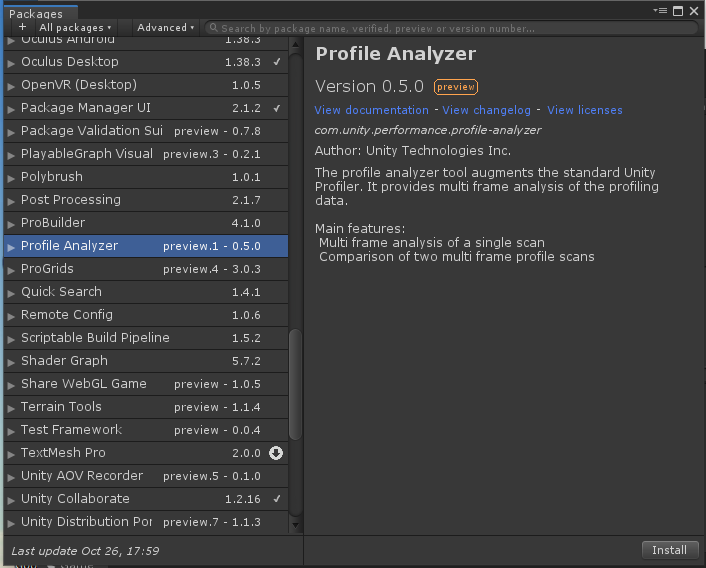
Once that is done, you can launch the Profile Analyzer from the Window -> Analysis menu. (Older versions of Unity may work slightly differently.)
Now with the AutoProfile script in the scene and the Profile Analyzer installed, here is the new procedure for obtaining performance measurements.
- As explained in the last post, I follow these steps:
- Configure Player Settings for a resizable window and with Oculus settings.
- Create a development build.
- Open the Unity Profiler with CPU, GPU, and Rendering profilers enabled.
- Start the Oculus Debug Tool and enable the Performance HUD.
- Launch the development build using the Oculus Debug Tool.
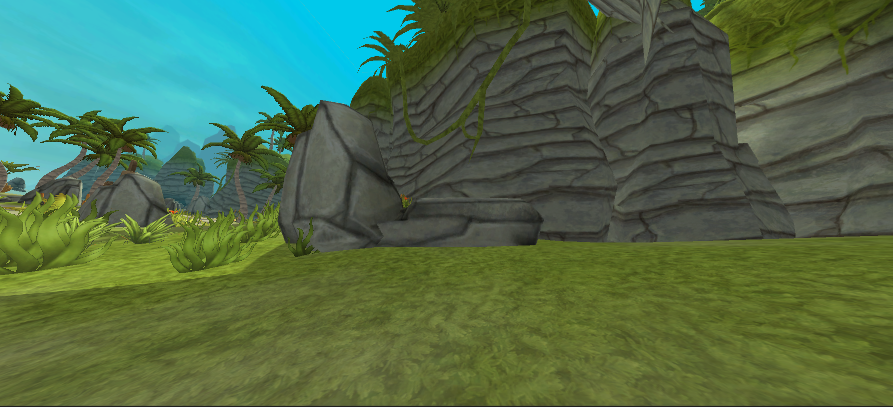
Then, with the island scene running, I use w/a/s/d or arrow keys to manipulate the first person controller and move through the scene. A performance profile is recorded with the recording automatically ending after 10 seconds thanks to the AutoProfile script. A water sound that I can hear through the Rift headphones tells me when the profile recorded has started and ended. While the test is running, I simply move forward through the island scene, skirting a bit to the side to avoid rocks and other obstacles.
I observe in the Performance HUD that the frame rate is usually about 90, but occasionally this value dips down while at the same time some frames are dropped.
Using the captured performance profile and the Profile Analyzer, specific measurements are taken like this:
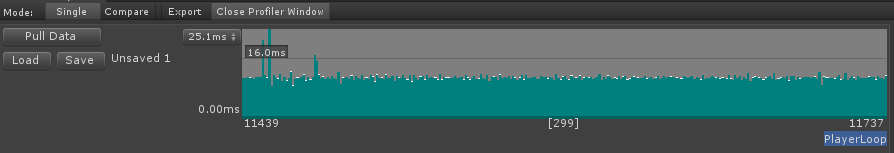
- Start the Profile Analyzer tool.
- Click the Pull Data button to import the data from the Profilers.
The Profile Analyzer then provides a Frame Summary that indicates the frames having the maximum, median, mean, min, and other frames by CPU time.
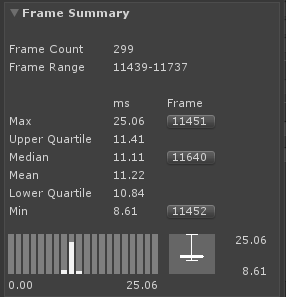
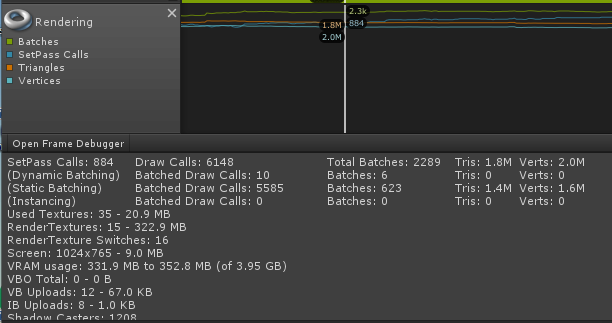
- I click on the button next to the Median frame. This orients the Unity Profiler to that specific frames. Specific values can be taken from the Profiler for CPU time, GPU time, draw calls, triangles, and vertices.
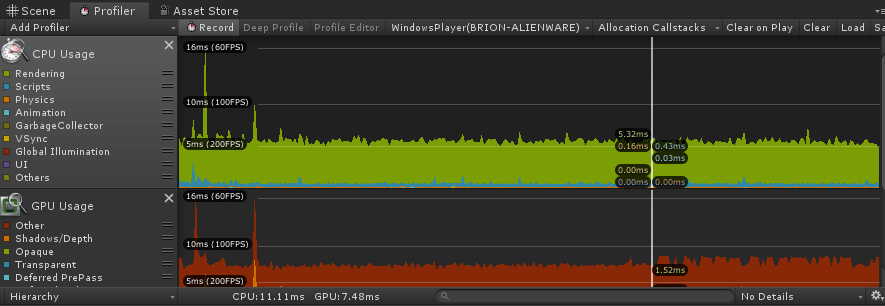
I ran 3 trials to see whether the measured performance would be consistent. The results are in the table below.
| Frames per Second | CPU time | GPU time | draw calls / frame | triangles / frame | vertices / frame | dropped frames | |
|---|---|---|---|---|---|---|---|
| Goal | 90 consistently | at most 11 ms | at most 11 ms | 50 - 100 | 1-2M | 1-2M | rare, maybe a few at scene transitions |
| Trial 1 | 90 but with downward spikes | 11.11 ms | 7.48 ms | 5619 | 1.6M | 1.8M | some during spikes |
| Trial 2 | 90 but with downward spikes | 11.15 ms | 7.48 ms | 6160 | 1.8M | 2M | some during spikes |
| Trial 3 | 90 but with downward spikes (more frequent) | 11.19 ms | 7.53 ms | 6148 | 1.8M | 2M | during spikes (more frequent) |
In the third trial I more aggressively “ran through plants,” whereas in the first two trials I attempted to steer clear of them. The metrics are quite consistent among all three trials, although there are more lost frames on the third trial where running through plants brought more detailed scenery closer to the camera.
It now seems as though we have a recipe for getting reasonably consistent and repeatable performance metrics. This has taken some setup, but finally in the next blog I will try the first of several ways to improve the performance.
From our baseline metrics it is apparent that our number of draw calls is much too high. Other metrics are nearly within the target, although keeping in mind that the Sharkferno game will be more than just the island environment, we need to reduce those also.
Why not just sell it like this charge whatever they need to make a profit but sell it like this