Now that I have set up a test island environment in Unity that I can explore in virtual reality using an Oculus Rift, I will set up tools for measuring performance. I will measure baseline performance to determine how far the island scene is from acceptable VR performance.
A good summary of relevant performance tools is described in the Oculus Development Center. There are a lot of tools to consider. To stay focused, let’s keep in mind the important performance goals for smooth VR:
| Unity Stats display | Unity Profiler | Oculus Performance HUD | |
|---|---|---|---|
| Frames per Second | Game Window only | CPU Profiler | Performance Summary |
| CPU time | Game Window only | CPU Profiler | |
| GPU time | GPU Profiler | ||
| draw calls | Rendering Profiler | ||
| triangles / vertices | Game Window only | Rendering Profiler | |
| dropped frames | Performance Summary |
From this table we can see that we can get all the measurements we need using the Unity Profiler and the Oculus Performance HUD. There are many other tools that are helpful for specific purposes, but we will focus on these two for VR performance tuning. These tools are well documented, so I am not going to repeat that information in this blog; it is easy to find how to use the tools themselves. What I will do is list out a step-by-step recipe for using these tools to gather the needed measurements.
I won’t use the Unity Stats display because it only runs in the Unity Game Window. For accurate performance measurements, I will use compiled game builds rather than running in the Unity Editor.
Recipe for Collecting Performance Measurements
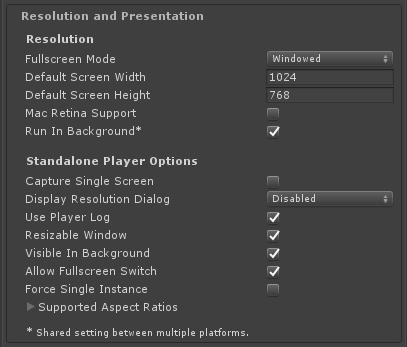
In Unity Player Settings, I set the Fullscreen Mode to be Windowed so that the application does not take over the full screen. I want to be able to see the Unity Profiler as we run. I check “Resizable Window” for this to work. I also turn off Mac Retina Support, since I am not using a Mac for this.
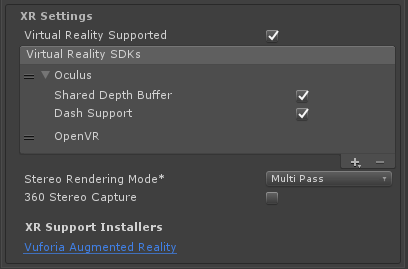
Of course XR settings must be configured for Oculus Rift. I just accepted the defaults. Perhaps importing the Oculus Integration into Unity set this up already.
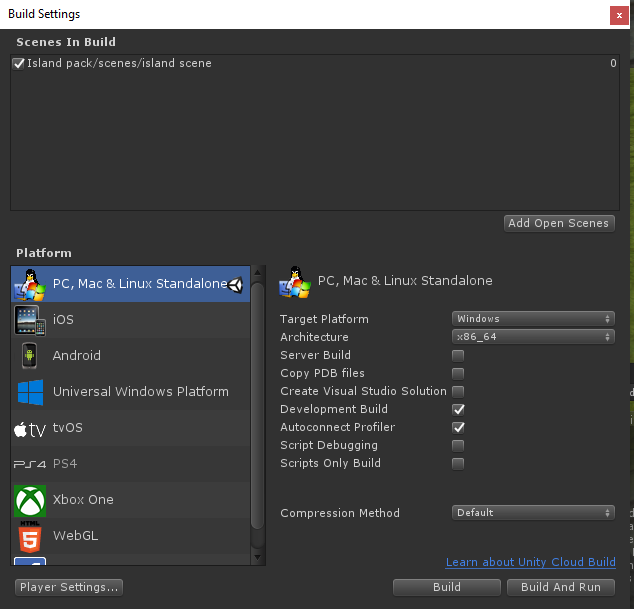
In Unity Build Settings, I select the PC, Mac & Linux Standalone platform and include the island scene. Also very important, I click on Development Build and Autoconnect Profiler.
Then I build the application, the Island test scene.
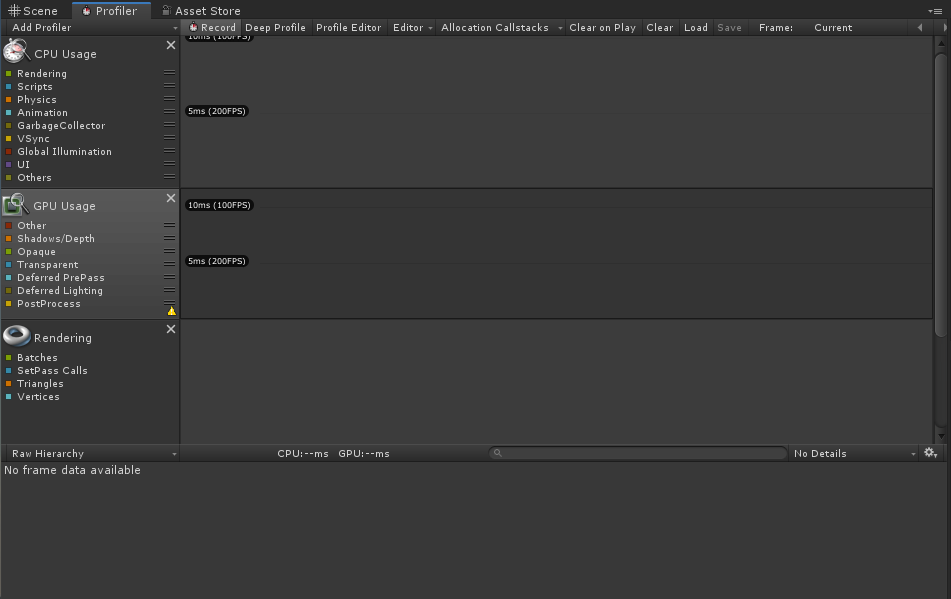
Next, I open the Unity Profiler window with these Profilers enabled: CPU, GPU, and Rendering.
I then start the Oculus Debug Tool as instructed in its documentation. I set the Visible HUD to Performance and the Mode to Performance Summary.
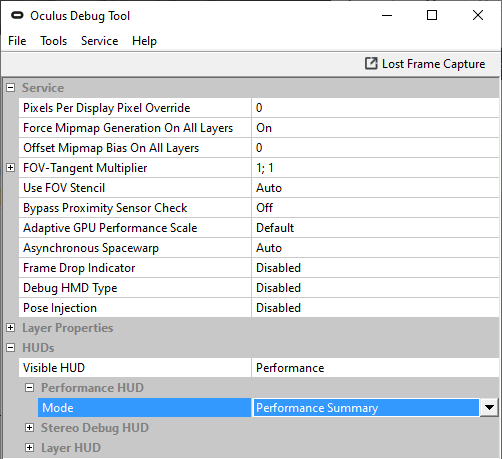
After all this setup, I start the built compiled scene executable via the Oculus Debug Tool’s File -> Launch App… menu item.
I then run the test scene from within the Oculus. Using the arrow keys I am able to move through the island environment. The Oculus Performance HUD appears superimposed over what I see using the Oculus.
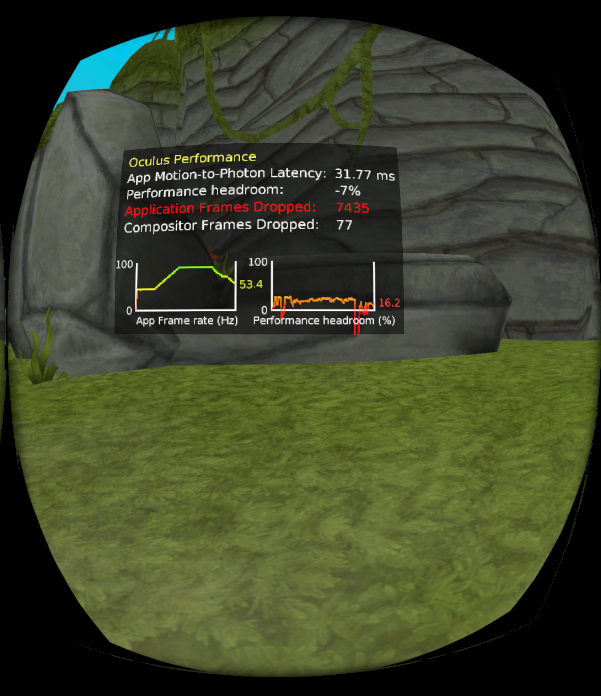
Observations:
- The frames per second usually stays close to 90 fps, which is good.
- However, the Performance Headroom intermittently goes negative. When that happens, fps dips down and frames are dropped. Clearly there are issues.
Next, I would like to get some metrics from the Unity Profiler. The Profiler captures a continual trace of data while the application is being used. To freeze a trace for inspection, I need to toggle off the Record button on the Profiler. This is a bit tricky while wearing the Rift.
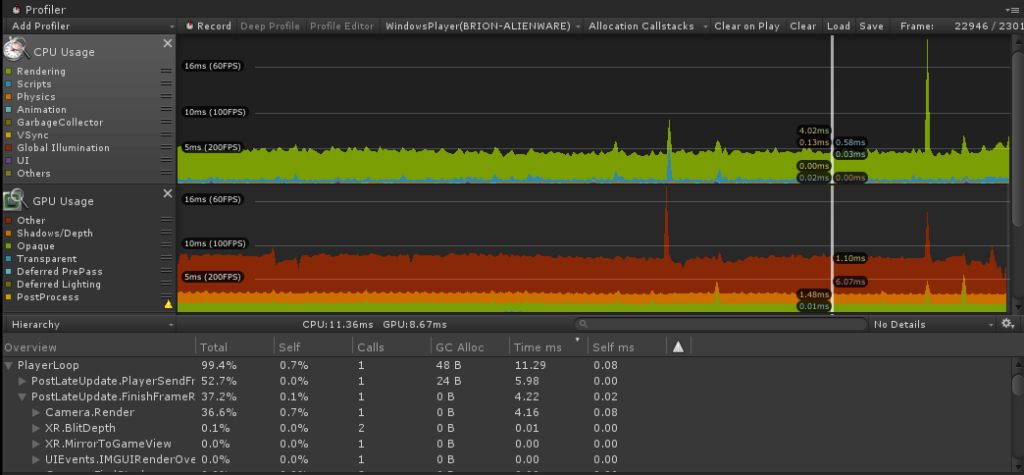
In the CPU Profiler I see that:
- CPU time is usually about 11ms / frame, but with occasional spikes. One cause of spikes is XR.WaitForGPU. While this is happening, the GPU seems to be taking longer than usual with Device.Present. Another cause of CPU spikes is simply Camera.Render which indicates that there is just too much to draw.
- GPU time is usually about 8ms but with occasional spikes.
- Numbers of triangles and of vertices per frame is about a million each, which is within Oculus’ guidelines.
- Number of draw calls per frame 3600-4000, which far exceeds Oculus’ guideline of 50-100.
Here is a table to summarize all the baseline measurements:
| Frames per Second | CPU time | GPU time | draw calls / frame | triangles, vertices / frame | dropped frames | |
|---|---|---|---|---|---|---|
| Goal | 90 consistently | at most 11 ms | at most 11 ms | 50 - 100 | 1-2M | rare, maybe a few at scene transitions |
| Baseline | 90 but with downward spikes | 11 ms but with upward spike | 8 ms but with upward spikes | 3600-4000 | about 1M | a bunch during spikes |
In summary, there are far too many draw calls and spikes in performance. Also, these measurements are for the environment only, not the many objects and scripts that will implement Sharkferno within the environment, so just considering the island environment, I need to achieve the performance goals with room to spare. The good news is that I now have baseline measurements so I will know when I have made improvements.
The next series of blog entries will each try a specific change to the Unity environment and then re-measure the performance. These will be experiments to find out how much different types of changes help achieve the performance goals. Of course I hope to discover that a few easy changes will result in the performance we need for a smooth VR experience. We will see…